Product Carbon Footprint (PCF), Explained
Step-by-step guide to how product carbon footprints are calculated, and why you and your stakeholders need them.
Are your customers making purchasing decisions based on GHG emissions? Is your company aiming to sell verifiably lower-carbon products? Then you need to generate Product Carbon Footprints (PCFs).
By developing full PCFs, you can understand your organization’s carbon hotspots across the production of your goods, report a product’s emissions to customers, banks or regulators, and identify how to reduce those emissions.
What is a product carbon footprint?
A product carbon footprint (or PCF) is the calculation of all of the greenhouse gas (GHG) emissions generated in the supply chain of a specific product. It is usually expressed as a carbon intensity.
For example:
- A car in a showroom might have its carbon intensity expressed as 40 tonnes of carbon dioxide equivalent (tCO2e) per vehicle.
- A consignment of aluminum might have its carbon intensity expressed as 18 tCO2e per tonne of aluminum. The total emissions of that consignment might also be reported.
Product carbon footprinting is also referred to as ‘product life cycle accounting’, ‘product life cycle assessment’ (LCA) or ‘product life cycle emissions inventories’. However, LCAs commonly cover a broader range of environmental impacts than just GHG emissions.
What do we mean by a ‘product’s supply chain’?
A product’s supply chain includes upstream activities (e.g. mining, transport and processing of materials that go into your company’s production processes) and downstream activities (e.g. delivery to customer and use and disposal of goods). However, not all PCF calculations include emissions from the downstream supply chain. These calculations are called partial lifecycle inventories (see guidance on boundaries below).
How are product carbon footprints (PCFs) calculated?
There are four overarching steps to calculating a PCF.
Step 1: Define the question
As emphasized in the seminal ‘Hitch Hiker’s Guide to LCA’ by Henrikke Baumann and Anne-Marie Tillman, the answer depends on the question.
This means being very clear on the goals and scopes of developing your PCF before selecting an approach. What you’re trying to achieve will impact how deeply you go into certain elements of the product life cycle, and your method of calculation.
This doesn’t mean altering your question until you get the answer you like or the answer that presents your products in the ‘greenest’ lights (that would be greenwashing).
Examples of the questions you (or your stakeholders) might be asking include:
- Roughly what is my product’s carbon footprint?
- Is my product lower or higher carbon than this other product?
- Where are the biggest hotspots in my product’s supply chain?
- Does my product meet my customer’s low-carbon threshold?
- Does my trade meet the exact criteria for a sustainability-linked loan?
- Which suppliers are higher or lower carbon?
- Which product supply chain emissions should I reduce to meet industry standards?
The question(s) you’re asking may be determined by requests your company receives for carbon footprinting or by regulatory requirements.
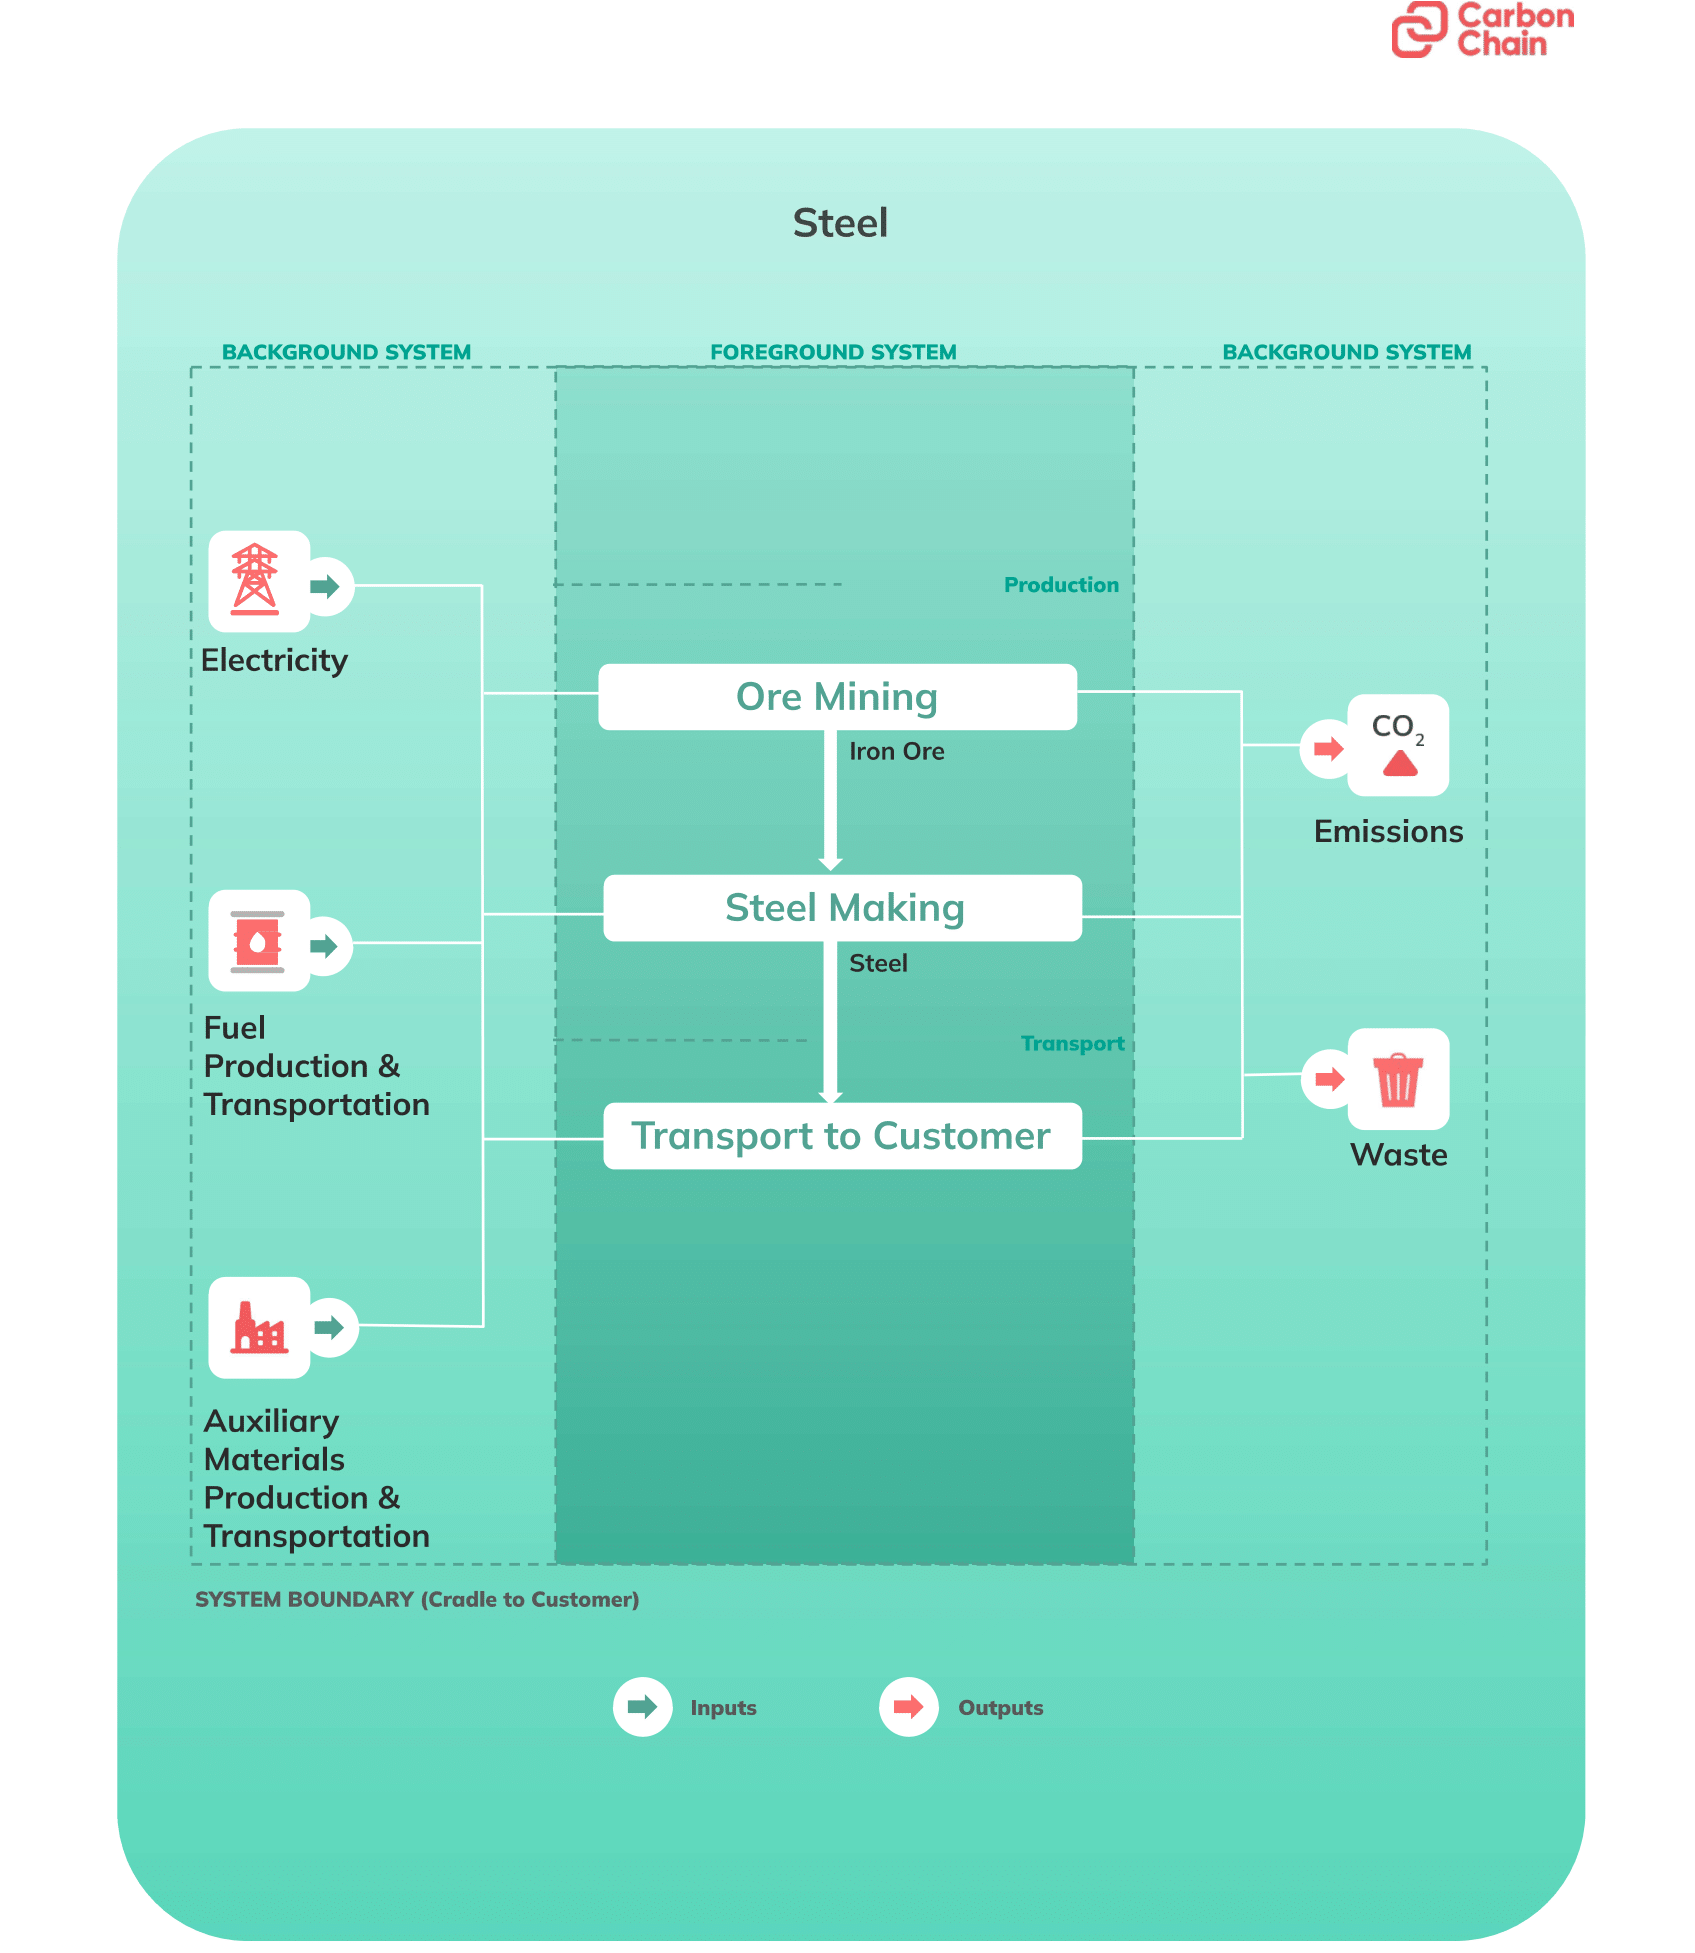
Step 2: Set the system boundary
The system boundary, or the product boundary, for the PCF can be either cradle-to-grave or cradle-to-gate. This will depend on the type of product you are selling:
- An intermediate product, where the final use of that product is unknown, will normally be evaluated cradle-to-gate (for example, an aluminum ingot);
- A final product should be evaluated cradle-to-grave (for example, diesel sold for use in a vehicle or a component built for batteries)
1. Cradle (extraction of raw materials) to grave (the whole lifecycle).
A cradle-to-grave PCF includes all the GHG emissions associated with the production of the product, from the extraction of raw materials to end-of-life, covering the product’s upstream and downstream supply chain.
Cradle-to-grave PCFs are particularly important in the oil and gas industry, because the most significant emissions take place downstream at the combustion stage.

2. Cradle to customer gate - the partial life cycle (also known as embodied carbon or embedded carbon)
In cradle-to-gate PCFs, the boundary ends at the factory gate, before delivery to customer, excluding any other downstream emissions (such as those generated in the use and disposal of the product).
-1.jpg)
Defining production steps
As part of setting the boundary of the PCF, you need to map out the production steps and establish each process’s inputs and outputs, for every life cycle stage within the system boundary.
Step 3: Collect the data
There are two kinds of data that a company needs to collect in order to calculate a product carbon footprint:
- Information about the production processes (within the boundaries set out)
- Emissions data (usually emissions factors)
The Greenhouse Gas Protocol (GHG Protocol) Product Life Cycle Accounting and Reporting Standard allows companies to make choices about the quality of the data they collect. In part, the decision depends on the question you are answering. If you are reporting detailed data for regulation and making claims about low-carbon products to customers, then you need to be extremely accurate and seek the highest-quality data.
The highest-quality data will include primary data that you know yourself and are in control of (including what you’ve purchased, what you’ve made, what you do with what you make, and the related emissions). It also includes data related to your product that don’t occur at your site — data that your customers and suppliers have. This involves asking them to report their primary data, or using asset-level carbon accounting software to fill in gaps.
Examples of primary activity data include:
- Liters of fuel consumed by a process in the product’s lifecycle, either from a specific site or on average across all production sites;
- Kilowatt-hours consumed by a process from an individual site or an average across sites;
- Kilograms of material added to a process;
- GHG emissions from the chemical reaction of a process.
If you are only aiming for a high-level estimate, or if you cannot fill certain data gaps with primary data, then using default data is the next best option. This involves using average emissions factors or modeling information about production processes. Such data may be publicly available or come from specialist databases.
There may be a compromise between speed and accuracy. However, solutions like CarbonChain enable both accurate and fast PCF calculations.
Each choice about data quality has both drawbacks and advantages. It’s highly advantageous to start gathering the highest quality data possible. Any company that starts with lower quality data to answer immediate questions through estimates should then implement processes to improve data quality over time, in order to obtain more robust results that can be communicated to stakeholders.
Step 4: Calculate the emissions
To calculate the PCF, use the formula activity * emissions factor for every activity, to develop the product’s emissions inventory. If your production process also involves co-products or by-products, the GHG Protocol sets out methods to ensure your emissions calculations relate only to the product under analysis.
To align with the GHG Protocol, companies need to make further calculations for reporting purposes. These include (but are not limited to):
- Total inventory results calculated as carbon dioxide equivalent (CO2e) per unit of analysis;
- Percentage of total inventory results by life cycle stage.
How are product carbon footprints used?
Reporting emissions with product carbon footprints
A key use case of product carbon footprints is fulfilling customers requests. Manufacturers use CarbonChain to provide Product Carbon Footprints (PCF) that customers can trust, at the point of purchase or delivery, expressed as total emissions or emissions intensity.
A PCF is also the carbon component of an Environmental Product Declaration (EPD) and a life cycle assessment (LCA).
Unlike corporate carbon footprints, PCF reports are not typically broken down into scopes or categories. This is because all emissions related to a product's life cycle are included in its carbon footprint, regardless of where those emissions occur.
Reducing emissions with PCFs
For many companies, developing a PCF is not only about compliance and fulfilling requests; it’s about measuring emissions in order to set and achieve targets to reduce them in line with global climate goals.
This involves:
Mapping hotspots
Look at the biggest carbon hotspots in your PCF to identify where you can have the biggest impact on emissions reductions. Making a 1% improvement in a hotspot (for example, extracting or burning fossil fuels) could be more valuable than a 50% improvement in a non-hotspot (for example, the temporary storage of that product in a warehouse).
Decarbonizing hotspots
Plan and implement solutions to rapidly reduce emissions, prioritizing the biggest carbon hotspots.
For a manufacturer of aluminum products, making its aluminum rolling mill more energy efficient is important and necessary, but not as impactful on overall emissions reductions as addressing the hotspots in its upstream activities (that is, the emissions generated in the production of the primary aluminium the manufacturer purchases). Decarbonization solutions could include reducing waste on-site (to reduce the amount of primary aluminum that needs to be purchased), working with suppliers to decarbonize their processes and energy procurement, or switching suppliers.
➡️ CarbonChain's platform fills the supplier data gap so that manufacturers and commodity traders can identify hotspots, and screen assets and suppliers to achieve emissions reductions.
Why are product carbon footprints important?
PCFs are critical metrics in the transition to a net-zero economy, especially in high-emitting and hard-to-decarbonize sectors which may have large emissions variations depending on production processes. With a PCF, manufacturers and commodity traders can:
Inform decarbonization efforts
A tonne of aluminium can range between 3-20 tonnes of carbon dioxide equivalent in carbon intensity. PCFs reveal the highest and lowest emitting products, and the biggest carbon hotspots within a product’s supply chain. PCFs also enable companies to benchmark their performance against peers and competitors and set targets to lower their emissions towards net zero.
Inform market decision makers
PCFs enable buyers and trade finance providers to compare product emissions within product lines or from different suppliers, so they can make informed purchasing, financing and offsetting decisions.
Validate net-zero claims
Without data backing up their climate targets and decarbonization claims, companies risk being punished for greenwashing under increasingly stringent advertising regulations.

FAQs
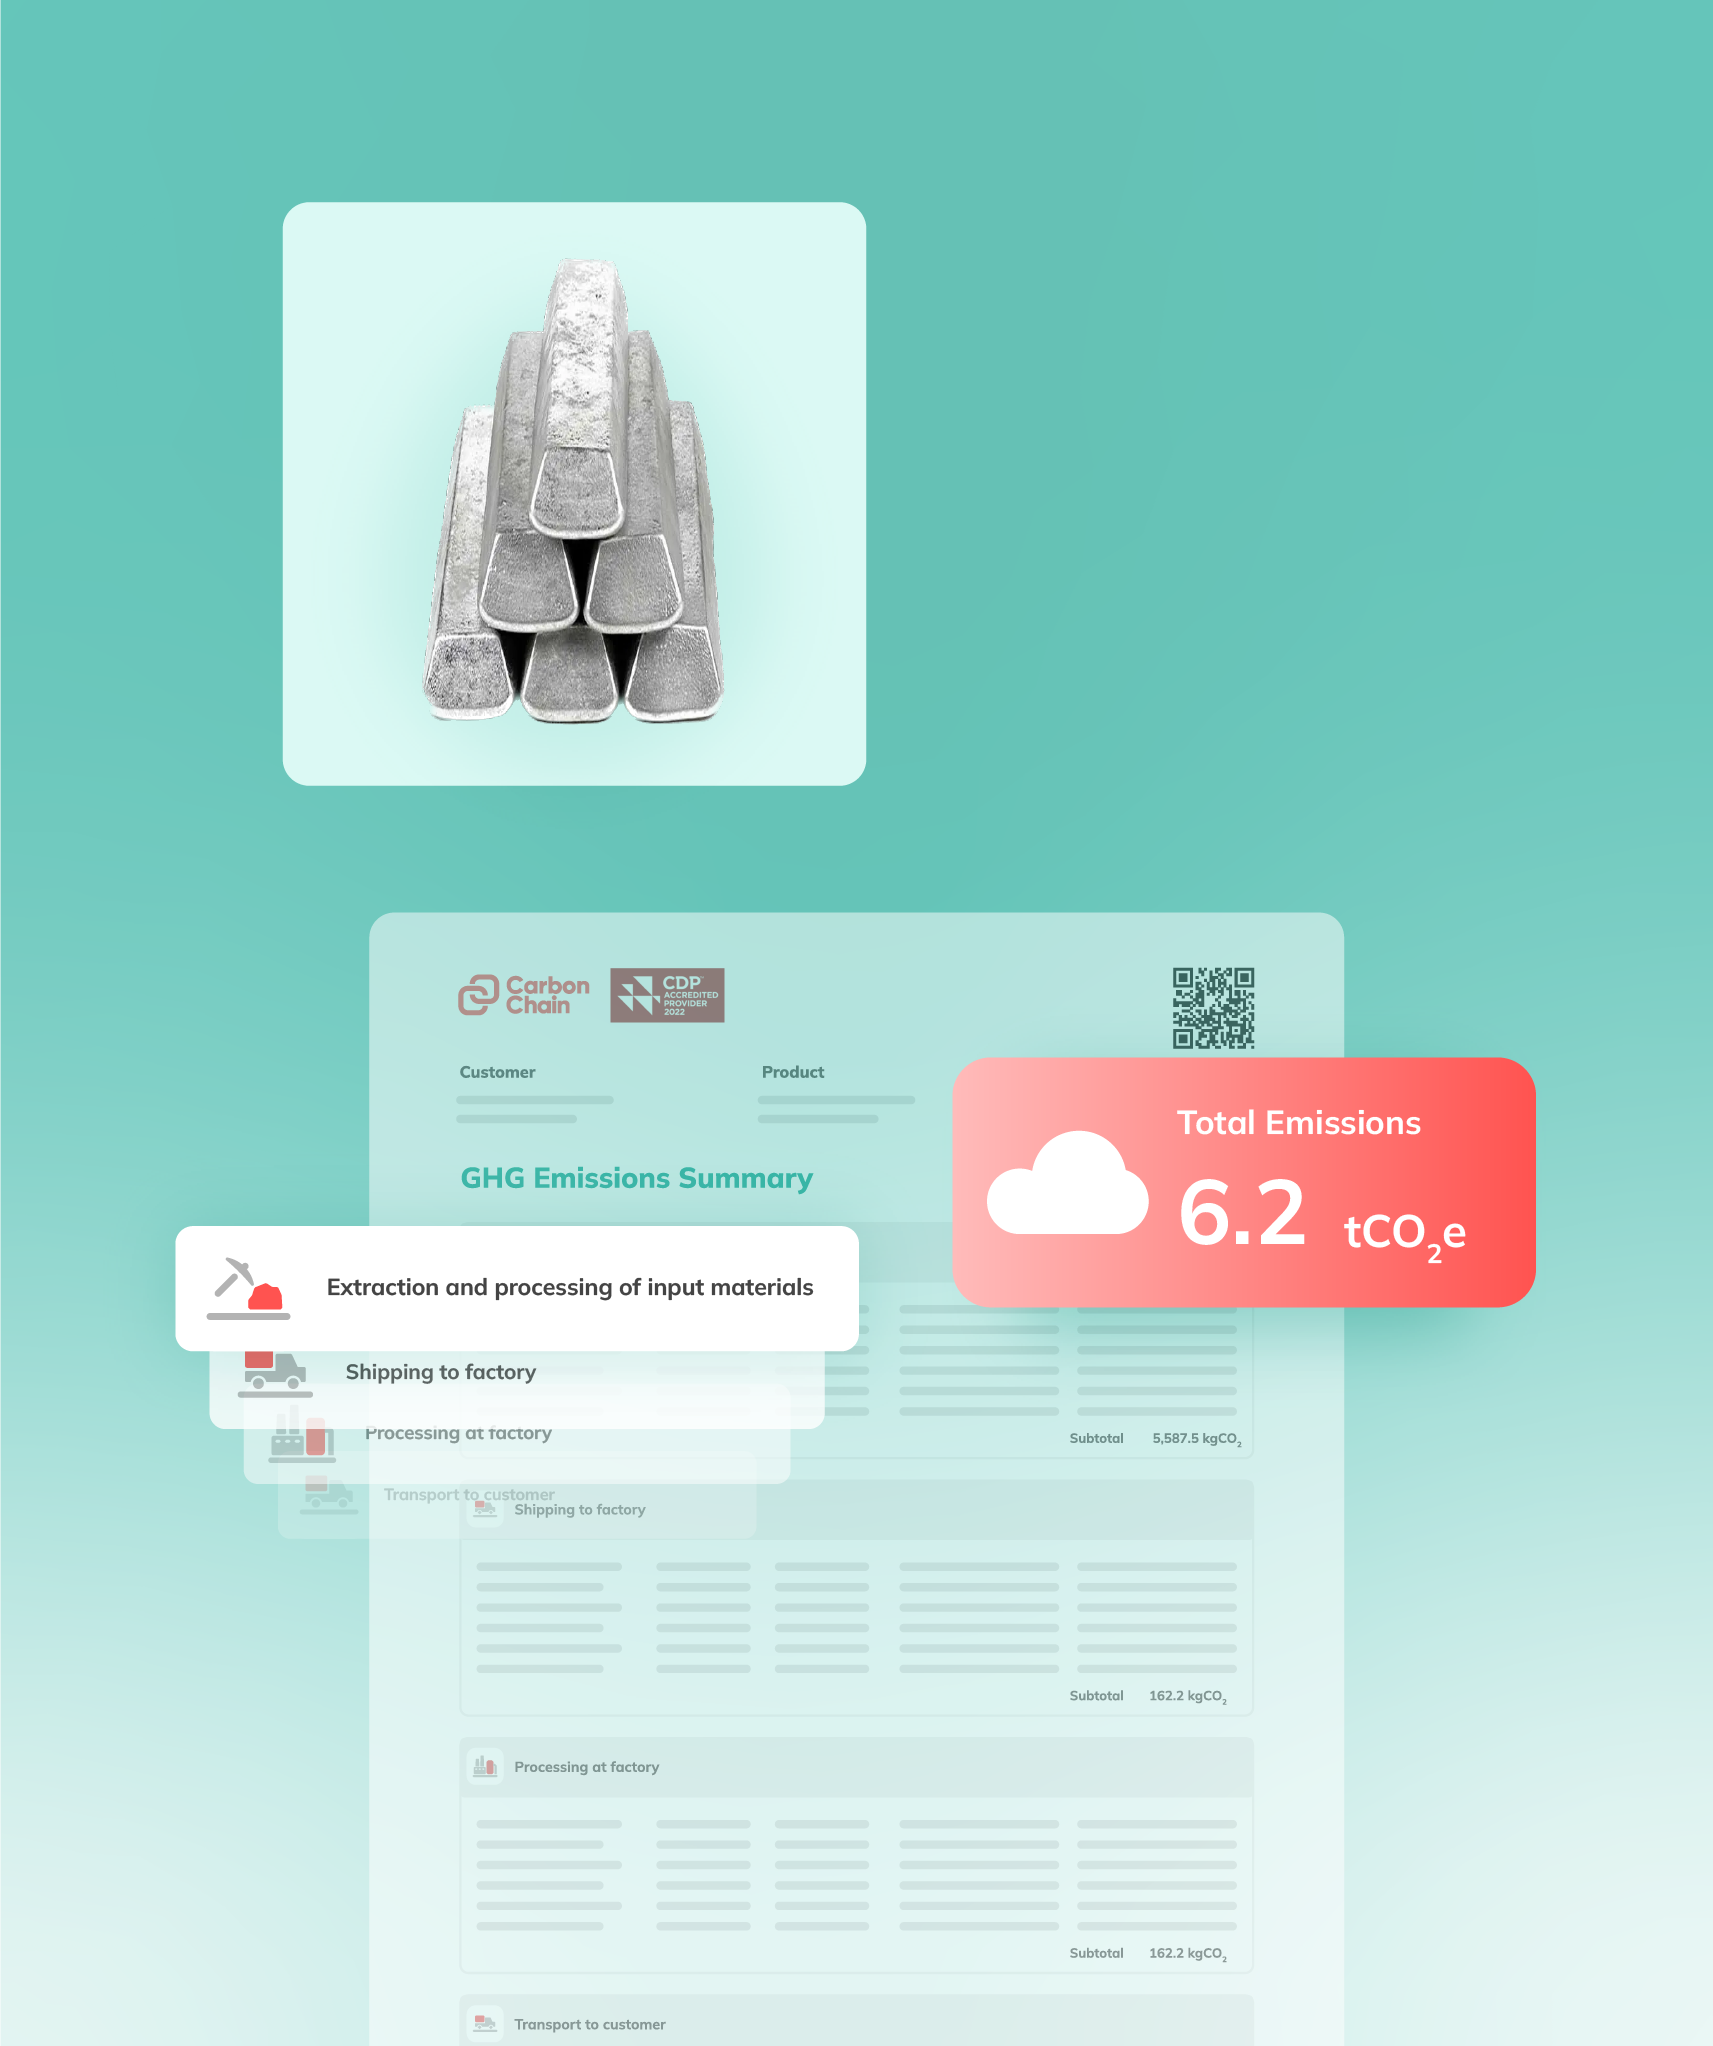
What is an example of a product carbon footprint?
A product carbon footprint will generally include the total emissions of the product, broken down into stages and sources. It may also include a carbon intensity rating (for example CarbonChain provides traffic light ratings based on industry benchmarks).
What is the difference between corporate and product carbon footprint?
A corporate carbon footprint covers all of a company’s operational and value chain emissions across Scopes 1, 2 and 3. On the other hand, a PCF calculates the emissions generated in the production of a specific good, including processes and activities that the company has direct control over as well as those in the supply chain. A lot of the emissions included in a PCF are also included in a corporate carbon footprint (or corporate GHG emissions inventory).

How does product carbon footprinting work in trade finance?
When trade finance providers request the carbon footprint of a transaction or of their financed trade emissions, commodity traders will generally need to calculate and report the PCFs of the product(s) traded.
By disclosing emissions in this way, traders can set decarbonization targets with banks for sustainability-linked loans.
How to report a product’s emissions for the EU CBAM?
Under the new EU Carbon Border Adjustment Mechanism (CBAM) regulation, importers are required to report emissions embedded in certain goods produced outside of the European Union. The approach to calculating and reporting emissions for CBAM purposes differs from Product Carbon Footprints. The UK's CBAM is likely to follow the EU's lead.
Download the factsheet
Oops! Something went wrong while submitting the form.
X